How to Easily Monitor Cluster Status
- Written by Vanessa Vasile
- Published in DNS, Howto
- Leave a reply
- Permalink
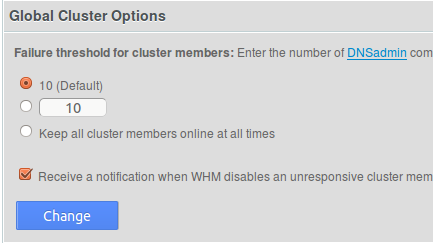
If you are running cPanel 11.28 or higher (which we hope you are, considering the current release at the time of this writing is 11.40!), you have the option in WHM to automatically disable DNS clustering if too many connection failures occur:
While this can be a handy feature, if you have a high-capacity system that frequently makes DNS updates, this could create complications. The easy way out is to of course select the third option to keep the cluster members online, however, this could slow down DNS changes (adding/removing domains, etc) if your cluster members are unavailable. Choosing to receive notifications may be a viable option, but some administrators receive so much email to the WHM admin contact address that the email alerts may not be as visible as they need to be.
If you have a monitoring system that supports custom plugins, such as Nagios, you can monitor the status of the cluster simply be looking for a few files. When DNS clustering is globally enabled, a file called /var/cpanel/useclusteringdns will exist, and all cluster members will be enabled by default. The status files for specific cluster members are stored conveniently in /var/cpanel/clusterqueue/status/, and will be named as follows:
- $IP: This file always exists, and has binary contents. If it contains all 1’s, everything is fine. If it has 0’s in it, connection failures have occurred. Of course, $IP represents the actual IP address of the remote cluster member
- $IP-down: This file will exists when a cluster member is down. Deleting this file will re-activate the cluster member.
You can also monitor the following folders which may help ore-emptively identify a DNS problem or overload within your clustering system:
- /var/cpanel/clusterqueue/retry/: Contains a single file for each request to the cluster that has failed. Having too many of these will indicate a problem reaching one or more members of the cluster
- /var/cpanel/clusterqueue/requests/: Contains a single file for each request to the cluster that has not yet synchronized. Having too many of these at once will indicate heavy activity on the server. If this activity is unusual, it may need to be investigated.
Knowing what files to look for can allow you to write your own monitoring scripts and/or Nagios plugins to periodically check for clustering problems, or attempt to automatically fix them, if you don’t want to rely on email notifications.

